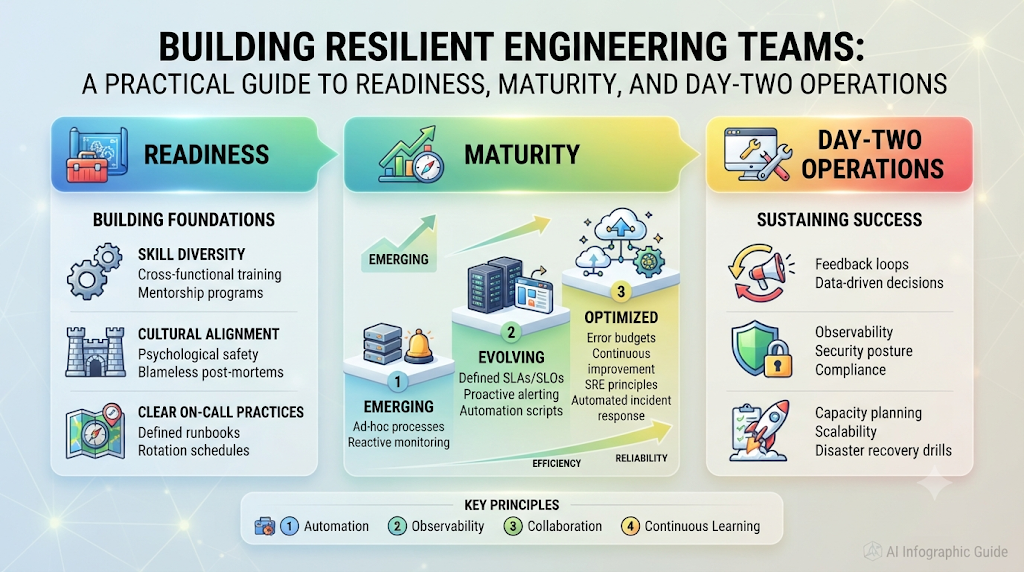
Ask any on-call engineer what keeps them awake at night, and you rarely hear complaints about writing application code. The real stress shows up after deployment—when traffic surges unexpectedly, a container keeps restarting without clear logs, or cloud bills climb faster than user growth.
In day-to-day software operations, smooth launches depend on habits built long before release day. Teams need shared clarity on who owns a service, how alerts behave under pressure, how security checks run automatically, and where current workflows fall short.
Written from the viewpoint of a hands-on platform and reliability practitioner, this guide walks through how engineering teams test their preparedness, map out realistic improvements, and solve common production headaches. You will explore practical habits across readiness reviews, Kubernetes workloads, observability, incident handling, security, and cloud spending. To explore structured assessments, operational checklists, and team improvement plans, visit OpsRoadmaps.
Why Day-Two Operations Decide Software Success
Writing features is “day one.” Keeping software fast, safe, and affordable for months and years is “day two.” Many organizations pour energy into feature velocity while leaving operational guardrails to chance.
When systems stay small, informal habits work fine. Once dozens of microservices, shared clusters, and multiple delivery squads interact, undocumented assumptions break down:
- Alert Noise: Engineers ignore Slack channels flooded with low-value warnings, missing the one alert that signals real user pain.
- Fragile Releases: Deployments require manual steps, making rollbacks slow and nerve-racking during an outage.
- Hidden Cost Leaks: Orphaned load balancers, oversized nodes, and forgotten test environments quietly inflate monthly invoices.
- Unclear Boundaries: Development and operations teams point fingers when nobody defined ownership for runbooks, secrets rotation, or capacity planning.
Grounded Principle: Structured operational reviews are diagnostic tools, not pass-or-fail exams. A high readiness score never guarantees zero outages or formal compliance certification—it simply shows where your team has strong habits and where real risks still hide.
Evaluating Your Starting Point Before Changing Tools
Buying new software rarely fixes broken team habits. Before introducing fresh platforms or rewriting pipelines, gather honest facts about how your organization works today.
Performing a Production Readiness Assessment
A production readiness assessment checks whether an application, service, or infrastructure component can survive live user traffic without constant manual intervention. Instead of relying on verbal assurances before a launch, teams verify tangible proof across five pillars:
- Service Ownership: A clear team owner, an active on-call rotation, and up-to-date escalation paths exist.
- Resilience and Recovery: Graceful timeouts, retry limits, backups, and tested rollback procedures are documented and verified.
- Signal Quality: Alerts reflect genuine customer symptoms (such as rising error rates or slow checkouts) rather than raw CPU spikes alone.
- Performance and Scaling: Load limits are understood, and autoscaling policies handle traffic bursts without starving dependencies.
- Security Hygiene: Credentials live in a dedicated secret manager, network rules block unnecessary lateral traffic, and vulnerability scans pass.
Running a DevOps Maturity Assessment
While readiness checks examine individual services, a DevOps maturity assessment evaluates how effectively your whole engineering group builds, tests, delivers, and operates software. It looks closely at version control workflows, automated test coverage, Continuous Integration and Continuous Delivery (CI/CD) reliability, Infrastructure as Code (IaC) adoption, and how teams learn after failures.
Early-stage teams depend on manual handoffs and individual heroics. Mature organizations automate routine verification, deploy small changes frequently, and treat production stability as a shared engineering goal.
Sequenced Roadmaps for Modern Engineering Disciplines
Once assessments expose your top gaps, translate those findings into focused, realistic tracks. Trying to overhaul every practice in a single quarter leads to burnout and half-finished migrations.
Platform Engineering Adoption Roadmap
When application developers spend hours copying YAML files, debugging IAM permissions, or filing tickets just to spin up a staging environment, velocity suffers. A platform engineering adoption roadmap removes that friction by offering self-service internal capabilities:
- Listen First: Interview app teams to uncover their biggest daily bottlenecks rather than guessing what tools they want.
- Create Paved Roads: Build standardized templates for CI/CD, observability, and service deployment that bake in security and reliability defaults.
- Keep Escape Hatches Open: Allow specialized workloads to customize configurations without breaking platform guardrails.
SRE Adoption Roadmap
Site Reliability Engineering (SRE) treats operations as a software problem. A practical SRE adoption roadmap helps teams balance feature speed with system stability:
- Measure User Happiness: Define Service Level Indicators (SLIs) for availability and latency, then set realistic Service Level Objectives (SLOs) agreed upon by both engineering and product leads.
- Govern Releases with Error Budgets: If a service stays within its allowable downtime budget, ship freely; if reliability drops below target, pause risky features to fix stability debt.
- Eliminate Repetitive Toil: Track manual, repetitive operational tasks and automate them systematically.
DevSecOps Implementation Roadmap
Treating security as a final pre-launch gate creates last-minute delays and friction. A DevSecOps implementation roadmap weaves automated protection directly into everyday developer tools:
- Shift Checks Left: Run static code analysis, open-source dependency audits, container image scans, and IaC policy checks inside pull requests.
- Enforce Least Privilege: Replace shared static keys with short-lived identities, automated secret rotation, and tightly scoped cloud permissions.
- Fix What Matters First: Rank vulnerabilities by actual runtime exposure so engineers tackle internet-facing risks immediately.
Cloud Cost Optimization Roadmap
Cloud flexibility makes it easy to spin up resources—and just as easy to forget them. A disciplined cloud cost optimization roadmap aligns engineering architecture with financial accountability (FinOps):
- Establish Clear Attribution: Require consistent tags or labels across namespaces, clusters, and cloud accounts so teams see their own spend.
- Trim Idle Capacity: Schedule non-production clusters to scale down overnight and remove unattached disks or unused snapshots.
- Connect Spend to Output: Track cost per customer, per API call, or per transaction alongside latency so optimization never harms user experience.
Comparing Maturity Across Observability and Incident Handling
Seeing how capabilities evolve helps teams pick sensible next steps instead of jumping straight to complex tooling.
| Operational Area | Foundational Level | Developing Level | Optimized Level |
| Observability Maturity Model | Teams check basic server metrics and log into individual machines to read text logs after users report issues. | Logs and metrics flow into central dashboards; alerts exist, though engineers still struggle with alert fatigue and manual correlation. | OpenTelemetry instruments services consistently; logs, metrics, and distributed traces connect cleanly, and alerts trigger on SLO burn rates. |
| Incident Management Maturity Model | Outages unfold in chaotic group chats; roles are unclear, and recovery depends on whoever happens to be online. | Severity levels, incident commanders, status updates, and basic troubleshooting runbooks guide active response. | Automated paging routes issues fast, teams rehearse failures via game days, and blameless reviews drive permanent fixes. |
Evaluating your team against an observability maturity model and an incident management maturity model prevents common mismatches—such as collecting terabytes of telemetry data that nobody knows how to query during a live outage.
Kubernetes Standards for Live Environments
Orchestrating containers in production demands clear baseline guardrails. Running every workload through a Kubernetes production readiness checklist protects clusters from noisy neighbors and avoidable downtime:
- Explicit Resource Boundaries: Define accurate
requestsfor scheduling andlimitsfor memory so runaway processes cannot crash underlying nodes. - Multi-Stage Health Checks: Use
startupProbefor slow-initializing apps,readinessProbeto control load-balancer traffic, andlivenessProbeto restart deadlocked containers. - Resilience During Maintenance: Run multiple replicas across availability zones and configure
PodDisruptionBudgetsso routine cluster upgrades stay invisible to users. - Hardened Runtime Defaults: Enforce non-root execution, drop unnecessary Linux capabilities, and restrict pod-to-pod traffic with
NetworkPolicies.
YAML
apiVersion: autoscaling/v2
kind: HorizontalPodAutoscaler
metadata:
  name: billing-worker-hpa
  namespace: finance
spec:
  scaleTargetRef:
    apiVersion: apps/v1
    kind: Deployment
    name: billing-worker
  minReplicas: 2
  maxReplicas: 10
  metrics:
    - type: Resource
      resource:
        name: cpu
        target:
          type: Utilization
          averageUtilization: 70
Hands-On Diagnosis: Kubernetes CrashLoopBackOff Troubleshooting
Few sights stress an on-call engineer faster than a production pod stuck in CrashLoopBackOff. Effective Kubernetes CrashLoopBackOff troubleshooting starts with remembering what the status actually means: the container starts, exits with an error, and Kubernetes waits progressively longer between restart attempts to protect cluster stability.
1. Gather Pod State and Events First
Run read-only inspection commands to understand why the container stopped:
Bash
kubectl get pods -n finance
kubectl describe pod billing-worker-5c8d7f9b4-q7r2t -n finance
Examine the Last State and Events sections closely:
- Exit Code 137 (
OOMKilled): The container exceeded itslimits.memoryceiling and was terminated by the kernel. - Exit Code 1 or 2: The application process failed on startup—often due to a missing secret, typo in a ConfigMap, or unreachable database endpoint.
- Liveness Probe Failure:
kubeletterminated the container because it failed to respond within the configured probe timeout.
2. Inspect Logs from the Failed Run
Because the container keeps restarting, inspect the output from the previous terminated instance:
Bash
kubectl logs billing-worker-5c8d7f9b4-q7r2t -n finance --previous
3. Fix the Root Cause Safely
- Config or Secret Errors: Correct the missing key or connection string in your ConfigMap or Secret, then roll out the update cleanly.
- Memory Exhaustion (
OOMKilled): Investigate memory leaks in application code or raiseresources.limits.memorybased on observed profiling data. - Probe Timeouts: Add a
startupProbeor extendinitialDelaySecondsso slow initialization completes before liveness checks begin.
Verify that newly scheduled pods reach Running and stay at 0 restarts:
Bash
kubectl rollout status deployment/billing-worker -n finance
kubectl get pods -n finance
Important Precaution: Simply running kubectl delete pod rarely solves CrashLoopBackOff—the Deployment controller immediately spins up a replacement pod with the exact same broken settings. Always fix the underlying configuration or resource constraint first.
Measuring What Matters Without Creating Metric Traps
Metrics should spark helpful engineering conversations, not anxiety. Pair three balanced measurement areas:
- Delivery Performance (DORA Metrics): Track deployment frequency, lead time for changes, change failure rate, and failed deployment recovery time to verify that faster releases do not come at the expense of stability.
- User Reliability (SLIs and SLOs): Measure real request success and latency experienced by users rather than relying solely on infrastructure uptime.
- Operational Health: Monitor off-hours alert frequency, runbook accuracy, and cloud unit costs.
Avoid copying arbitrary numeric benchmarks from tech blogs. Every organization operates under different regulatory, architectural, and budget realities—compare your numbers against your own historical baseline.
Common Mistakes That Stall Operational Progress
Even well-intentioned engineering teams run into predictable traps when trying to modernize operations:
- Chasing Tools Instead of Habits: Buying a shiny internal developer portal or APM suite will not rescue a team that lacks clear service ownership or incident roles.
- Writing Giant Unusable Checklists: A 90-question spreadsheet filled out once a year becomes shelfware. Keep readiness checks concise, practical, and integrated into real engineering workflows.
- Blaming Individuals After Outages: When postmortems focus on who ran a command rather than why the system allowed a dangerous action, engineers stop sharing honest feedback.
- Treating Assessments as One-Time Projects: Cloud architectures and team rosters change constantly. Revisit operational baselines every quarter so roadmaps reflect current reality.
How OpsRoadmaps Fits Into Your Improvement Workflow
Turning scattered operational observations into a clear, prioritized plan takes structure. OpsRoadmaps helps software engineering organizations assess their current capabilities across core disciplines—including DevOps, SRE, platform engineering, Kubernetes operations, security, observability, and FinOps—and translate identified gaps into practical improvement roadmaps. With explainable capability evaluations, actionable checklists, troubleshooting runbooks, and reusable templates, engineering teams and leaders can align on high-impact next steps without guesswork.
Frequently Asked Questions (FAQs)
1. What is the main goal of a production readiness assessment?
Its goal is to verify that a service and its supporting team have the monitoring, recovery plans, security controls, capacity, and ownership needed to run reliably in live traffic before problems affect users.
2. How does a DevOps maturity assessment differ from a security audit?
A DevOps maturity assessment evaluates engineering workflows, automation, collaboration, and delivery practices to guide internal improvement, whereas a security audit independently verifies compliance against formal regulatory standards.
3. Which items belong at the top of a Kubernetes production readiness checklist?
Accurate CPU and memory requests and limits, properly tuned readiness and liveness probes, multiple replicas with PodDisruptionBudgets, non-root security contexts, and working alerts tied to runbooks.
4. How do small teams start a platform engineering adoption roadmap?
Start small by standardizing the single most repetitive task—such as CI/CD pipeline templates or preview environment creation—and expand self-service golden paths based on developer feedback.
5. When is an organization ready for an SRE adoption roadmap?
Teams can adopt core SRE habits at almost any size by defining basic SLIs and SLOs for critical user journeys, tracking error budgets, and holding blameless postmortems after outages.
6. How does an incident management maturity model reduce downtime?
It replaces chaotic ad-hoc responses with clear severity definitions, assigned incident roles, tested communication channels, and structured follow-up work that prevents repeat failures.
7. What is the first practical step in a DevSecOps implementation roadmap?
Automate secret detection, dependency vulnerability scanning, and Infrastructure as Code policy checks directly inside your existing CI pipelines so issues get caught before deployment.
8. Why does an observability maturity model emphasize traces alongside logs and metrics?
Metrics show that something is wrong and logs show isolated events, while distributed traces connect requests across microservices so engineers can pinpoint exact bottlenecks fast.
9. How can teams execute a cloud cost optimization roadmap without hurting performance?
Tag all resources for clear ownership, shut down idle non-production environments, rightsize over-provisioned instances gradually, and watch latency SLOs closely during changes.
10. What should engineers check first during Kubernetes CrashLoopBackOff troubleshooting?
Run kubectl describe pod to check exit codes (such as 137 for OOMKilled) and kubectl logs <pod-name> --previous to inspect application crash messages before modifying deployment configurations.
Conclusion
Resilient software operations grow out of steady, everyday discipline rather than emergency heroics. When teams honestly assess their starting point, standardize production guardrails, automate security and telemetry, and learn openly from incidents, live systems become far calmer to run.
Choose one critical service this week, review its readiness across ownership, probes, alerts, and cost visibility, and turn your top two gaps into scheduled sprint tasks. Whenever you want structured capability evaluations, operational checklists, and actionable roadmaps for your engineering organization, visit OpsRoadmaps.